Your Best Seller May Be Losing You Money: What Your POS Should Reveal About Real Retail Profit
A busy store can report strong sales while quietly losing margin. Learn how a modern POS should expose the real effect of discounts, returns, payment fees, taxes, product costs, stock losses, and channel differences.
A Full Till Can Hide a Weak Business
A Saturday can look excellent on the dashboard: high transaction count, a strong average basket, and several products sold out. Yet the owner may discover later that the day produced very little profit. The promotion was deeper than planned, returns from the previous week were processed, card fees were high, two popular products had outdated costs, and one branch recorded stock loss.
Sales activity creates energy, but energy is not profit. A POS that celebrates gross sales without showing what was given back, discounted, taxed, paid to providers, or consumed by product cost can create false confidence.
For example, A Saturday can look excellent on the dashboard: high transaction count, a strong average basket, and several products sold out. Yet the owner may discover later that the day produced very little profit. The promotion was deeper than planned, returns from the previous week were processed, card fees were high, two popular products had outdated costs, and one branch recorded stock loss. A product sold at full price can be highly profitable. The same item sold with a coupon, returned once, resold at a markdown, and paid through an expensive channel may contribute almost nothing. Product profitability must follow the entire transaction, not stop at the first sale. The point is not to create a perfect accounting model inside the till, but to stop obvious margin leaks from remaining invisible.
Revenue, Net Sales, Gross Profit, and Cash Are Not the Same
Gross revenue is the value before deductions. Net sales usually subtract discounts and returns. Gross profit then subtracts the cost of goods sold. Cash received may include tax collected for the government and can differ from profit because settlement timing, refunds, supplier payments, and expenses follow different schedules.
These definitions must be visible inside the POS. When two reports use the word sales differently, managers can make opposite decisions from the same day. Every metric needs a formula, date range, tax treatment, and clear inclusion or exclusion of refunds and fees.
A product sold at full price can be highly profitable. The same item sold with a coupon, returned once, resold at a markdown, and paid through an expensive channel may contribute almost nothing. Product profitability must follow the entire transaction, not stop at the first sale.
For example, A product sold at full price can be highly profitable. The same item sold with a coupon, returned once, resold at a markdown, and paid through an expensive channel may contribute almost nothing. Product profitability must follow the entire transaction, not stop at the first sale. A Saturday can look excellent on the dashboard: high transaction count, a strong average basket, and several products sold out. Yet the owner may discover later that the day produced very little profit. The promotion was deeper than planned, returns from the previous week were processed, card fees were high, two popular products had outdated costs, and one branch recorded stock loss. The point is not to create a perfect accounting model inside the till, but to stop obvious margin leaks from remaining invisible.
The Product Report Must Include the Costs That Follow the Sale
Useful reports connect selling price, actual discount, average or landed product cost, return cost, payment fee, tax, commission, delivery subsidy, wastage, and stock adjustment. Not every store needs every cost in real time, but the gaps should be known.
Storewide averages are comfortable and dangerous. A 35 percent average margin can hide one category at 55 percent and another at 8 percent. Strong branch revenue can hide repeated manual discounts. A healthy average return rate can hide one product with a quality problem.
Break reports by product, category, supplier, branch, cashier, channel, promotion, customer type, hour, and payment method. The objective is not to create dozens of dashboards. It is to find the segment where the result changes.
For example, Sales activity creates energy, but energy is not profit. A POS that celebrates gross sales without showing what was given back, discounted, taxed, paid to providers, or consumed by product cost can create false confidence. Choose one action for every meaningful exception: correct a cost, change a price, stop a promotion, renegotiate a fee, train a cashier, investigate a return pattern, or count a product. Then check the effect next week. The point is not to create a perfect accounting model inside the till, but to stop obvious margin leaks from remaining invisible.
Average Numbers Hide the Decisions That Matter
Start the weekly meeting with exceptions, not totals. Which products sold more but earned less? Which promotions grew units while reducing gross profit? Which returns have no recorded reason? Which payment method costs the most? Which branch has unusual discounting or negative stock?
For example, Gross revenue is the value before deductions. Net sales usually subtract discounts and returns. Gross profit then subtracts the cost of goods sold. Cash received may include tax collected for the government and can differ from profit because settlement timing, refunds, supplier payments, and expenses follow different schedules. Gross revenue is the value before deductions. Net sales usually subtract discounts and returns. Gross profit then subtracts the cost of goods sold. Cash received may include tax collected for the government and can differ from profit because settlement timing, refunds, supplier payments, and expenses follow different schedules. The point is not to create a perfect accounting model inside the till, but to stop obvious margin leaks from remaining invisible.
Build a Weekly Profit Review Instead of Waiting for Month-End
Choose one action for every meaningful exception: correct a cost, change a price, stop a promotion, renegotiate a fee, train a cashier, investigate a return pattern, or count a product. Then check the effect next week.
Dashierly or any POS should make the path from sale to margin understandable. The system does not replace accounting, but it should give the store a timely operational view before the monthly statements arrive.
The real goal is not to prove that the store is busy. It is to understand which sales create healthy cash and repeatable profit, which sales merely move inventory, and which sales quietly make the business weaker.
For example, These definitions must be visible inside the POS. When two reports use the word sales differently, managers can make opposite decisions from the same day. Every metric needs a formula, date range, tax treatment, and clear inclusion or exclusion of refunds and fees. Break reports by product, category, supplier, branch, cashier, channel, promotion, customer type, hour, and payment method. The objective is not to create dozens of dashboards. It is to find the segment where the result changes. The point is not to create a perfect accounting model inside the till, but to stop obvious margin leaks from remaining invisible.
Keep reading
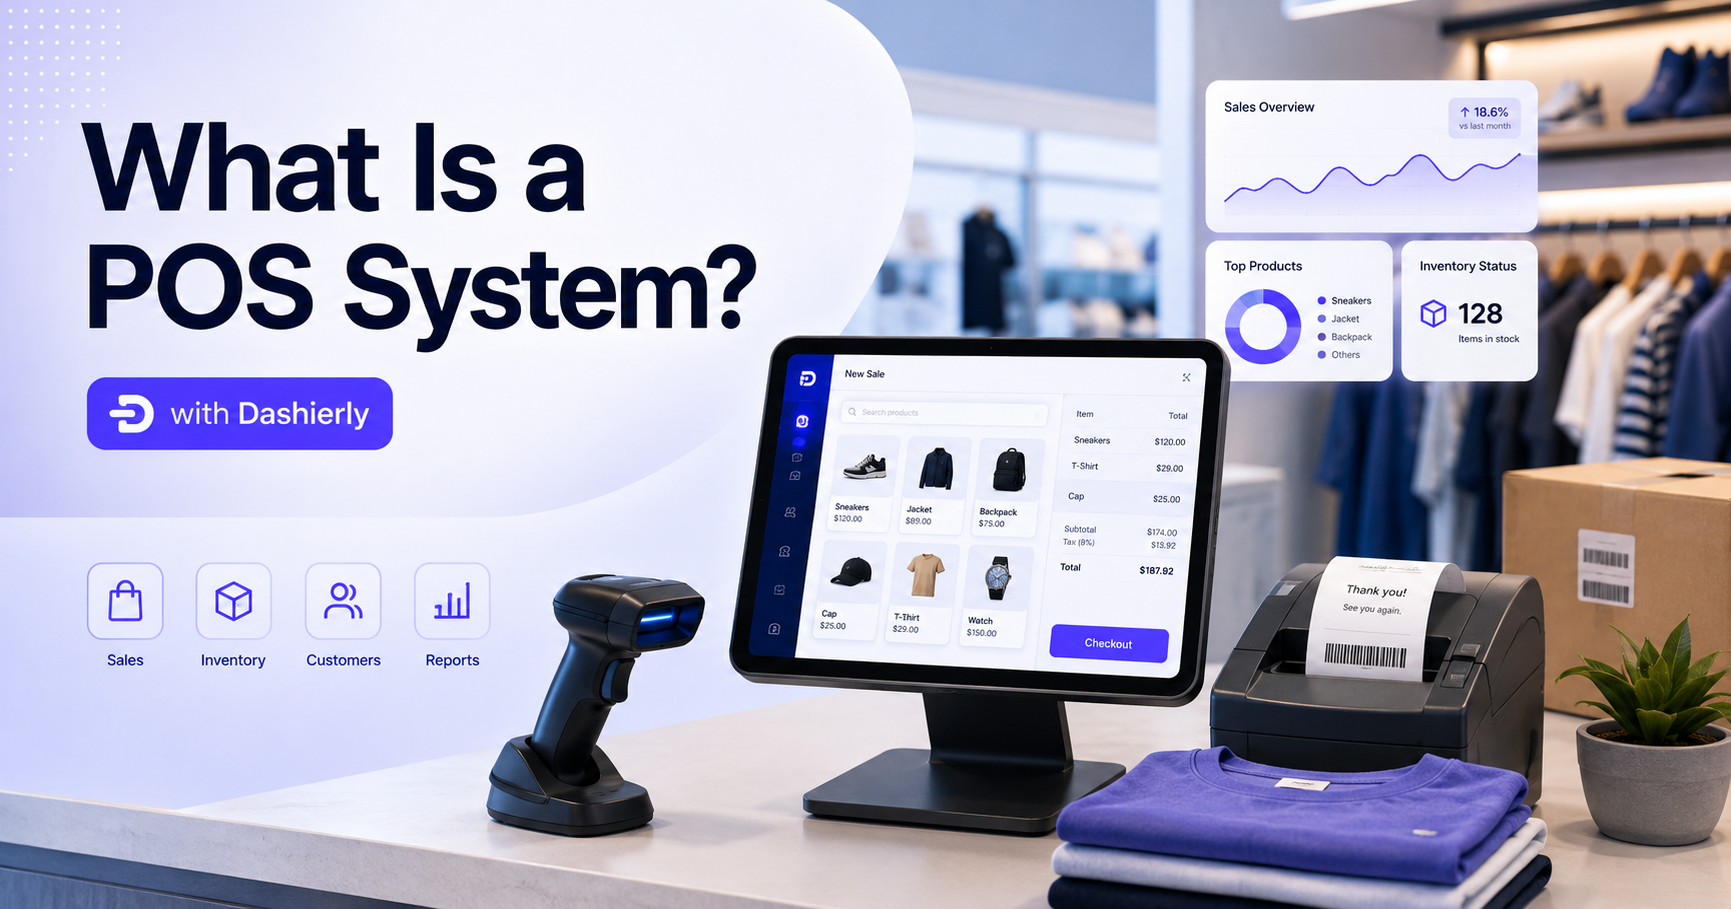
What Is a POS System? A Complete Guide to Modern Retail Management with Dashierly
Discover how a modern POS system helps retail businesses manage sales, inventory, invoices, returns, suppliers, customers, accounting, employees, branches, and reports. Learn what to look for when choosing retail software and how Dashierly brings daily store operations together in one connected platform.
Read article
The Day Wi-Fi Dies: Can Your POS Keep Selling in 2026?
A practical guide to offline POS, payment outages, local data, secure synchronization, and retail business continuity. Learn how stores can keep selling when the internet, cloud, or payment terminal fails.
Read article
AI-Powered POS Systems in 2026: The Future of Smart Retail Management
Explore the biggest POS trends of 2026, including AI analytics, predictive inventory, mobile checkout, cloud operations, and unified retail data—and learn how Dashierly helps stores build a future-ready foundation.
Read article